iptables
表
iptables 有 5 张表:
• filter(默认):决定"放过/丢弃"
• nat:做 NAT,专门改写源/目的 IP 和端口
• mangle:改 TTL、TOS 等
• raw:在 conntrack 之前操作
• security:SELinux 用
iptables 有 5 张表:
• filter(默认):决定"放过/丢弃"
• nat:做 NAT,专门改写源/目的 IP 和端口
• mangle:改 TTL、TOS 等
• raw:在 conntrack 之前操作
• security:SELinux 用
orbstack
vm-1: client
d2: caddy * 2
ipvs: lb
apt install -y ipvsadm conntrack tcpdump iproute2 net-tools curl iptables
sysctl -w net.ipv4.ip_forward=1
sysctl -w net.ipv4.conf.all.rp_filter=0
sysctl -w net.ipv4.conf.eth0.rp_filter=0

modprobe ip_vs
modprobe ip_vs_rr
modprobe ip_vs_wrr
modprobe ip_vs_sh
modprobe ip_vs_lc

ipvsadm -ln
iptables -t nat -S
ip addr show eth0
ipvsadm -C
ipvsadm -A -t 192.168.139.29:80 -s rr
ipvsadm -a -t 192.168.139.29:80 -r 192.168.139.184:80 -m # -m = NAT (Masq)
ipvsadm -a -t 192.168.139.29:80 -r 192.168.139.184:81 -m
ipvsadm -ln
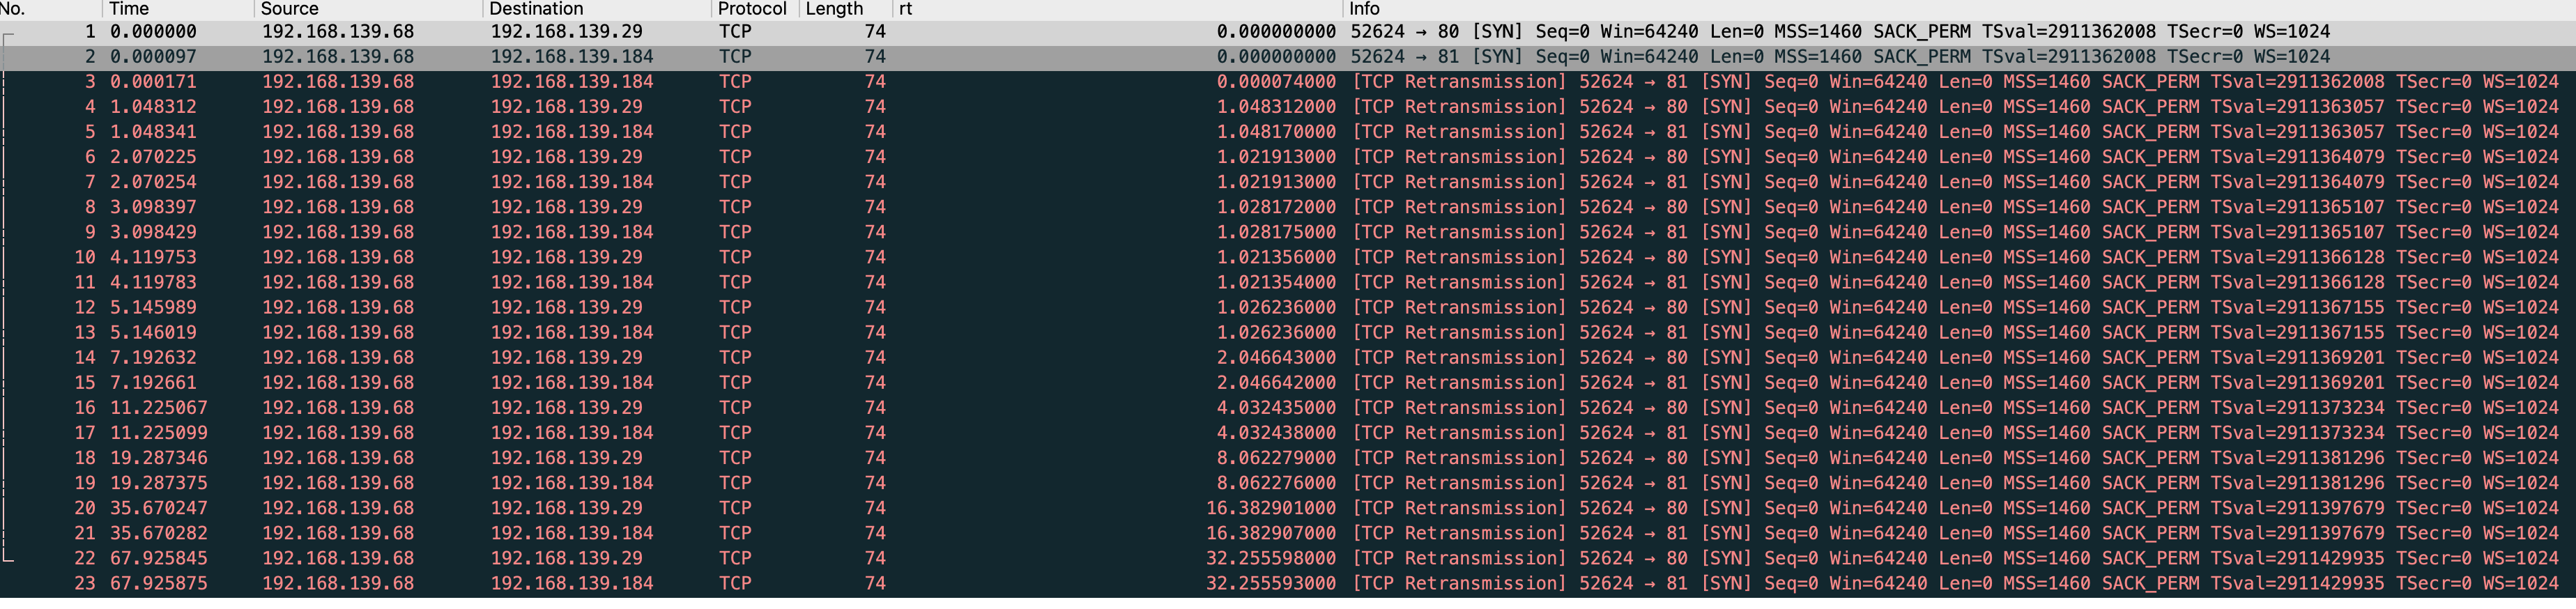
没有任何 iptables 规则,没有开 vs.conntrack。
tcpdump -i eth0 -s0 -X -nn 'port 80' -w ipvs/not-snat/nat-vm-1-eth0.pcap --print
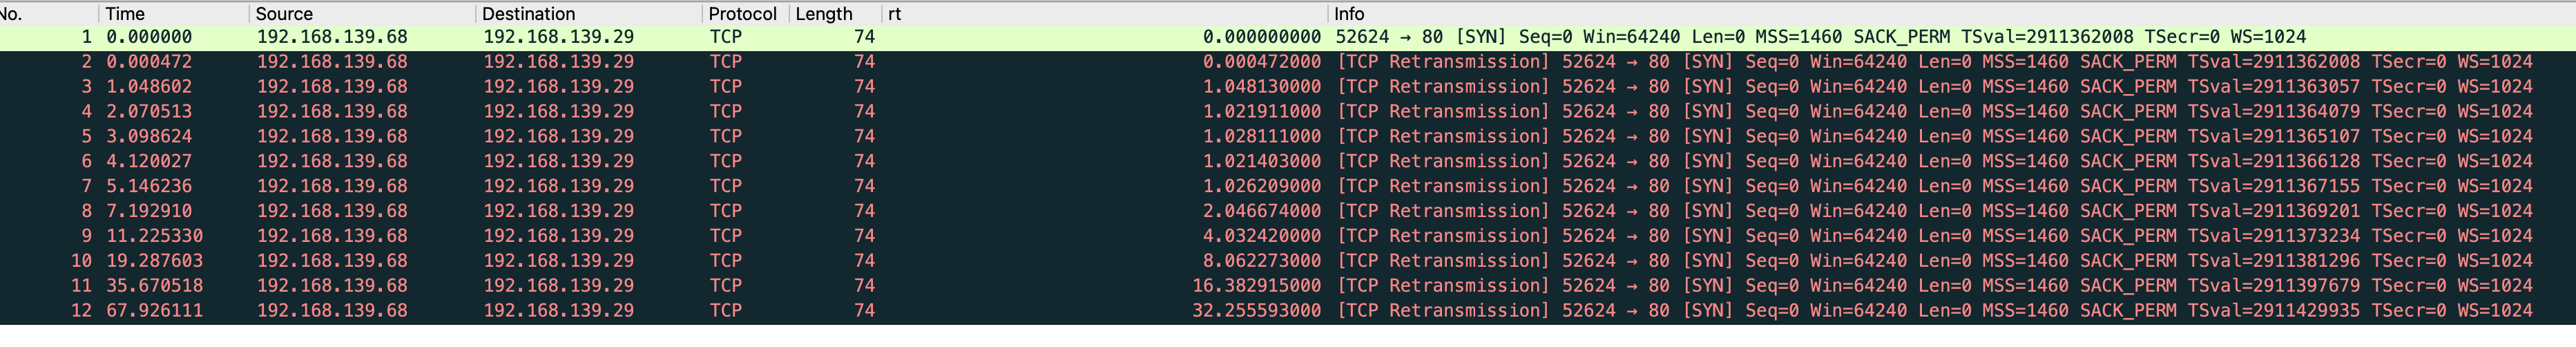
tcpdump -i eth0 -s0 -X -nn 'port 80 or port 81' -w ipvs/not-snat/nat-ipvs-eth0.pcap --print
tcpdump -i eth0 -s0 -X -nn 'port 80 or port 81' -w ipvs/not-snat/nat-d2-eth0.pcap --print
$ ipvsadm -lnc
IPVS connection entries
pro expire state       source             virtual            destination
TCP 00:59  SYN_RECV    192.168.139.68:37564 192.168.139.29:80  192.168.139.184:80
能看到一直卡在 SYN_RECV 所以 curl 会卡住
开启 conntrack
iptables -t nat -A POSTROUTING -d 192.168.139.184 -p tcp --dport 80 -j SNAT --to 192.168.139.29
iptables -t nat -A POSTROUTING -d 192.168.139.184 -p tcp --dport 81 -j SNAT --to 192.168.139.29

sysctl -w net.ipv4.vs.conntrack=1
iptables -t nat -S POSTROUTING
ipvsadm -ln
IP Virtual Server version 1.2.1 (size=4096)
Prot LocalAddress:Port Scheduler Flags
  -> RemoteAddress:Port           Forward Weight ActiveConn InActConn
TCP  192.168.139.29:80 rr
  -> 192.168.139.184:80           Masq    1      0          1
  -> 192.168.139.184:81           Masq    1      0          1
tcpdump -i eth0 -s0 -X -nn 'port 80' -w ipvs/snat/nat-vm-1-eth0.pcap --print
tcpdump -i eth0 -s0 -X -nn 'port 80 or port 81' -w ipvs/snat/nat-ipvs-eth0.pcap --print
tcpdump -i eth0 -s0 -X -nn 'port 80 or port 81' -w ipvs/snat/nat-d2-eth0.pcap --print
conntrack -L
tcp      6 84 TIME_WAIT src=192.168.139.68 dst=192.168.139.29 sport=43856 dport=80 src=192.168.139.184 dst=192.168.139.29 sport=80 dport=43856 [ASSURED] mark=0 use=1
tcp      6 46 TIME_WAIT src=192.168.139.68 dst=192.168.139.29 sport=47380 dport=80 src=192.168.139.184 dst=192.168.139.29 sport=81 dport=47380 [ASSURED] mark=0 use=1
conntrack v1.4.8 (conntrack-tools): 2 flow entries have been shown.
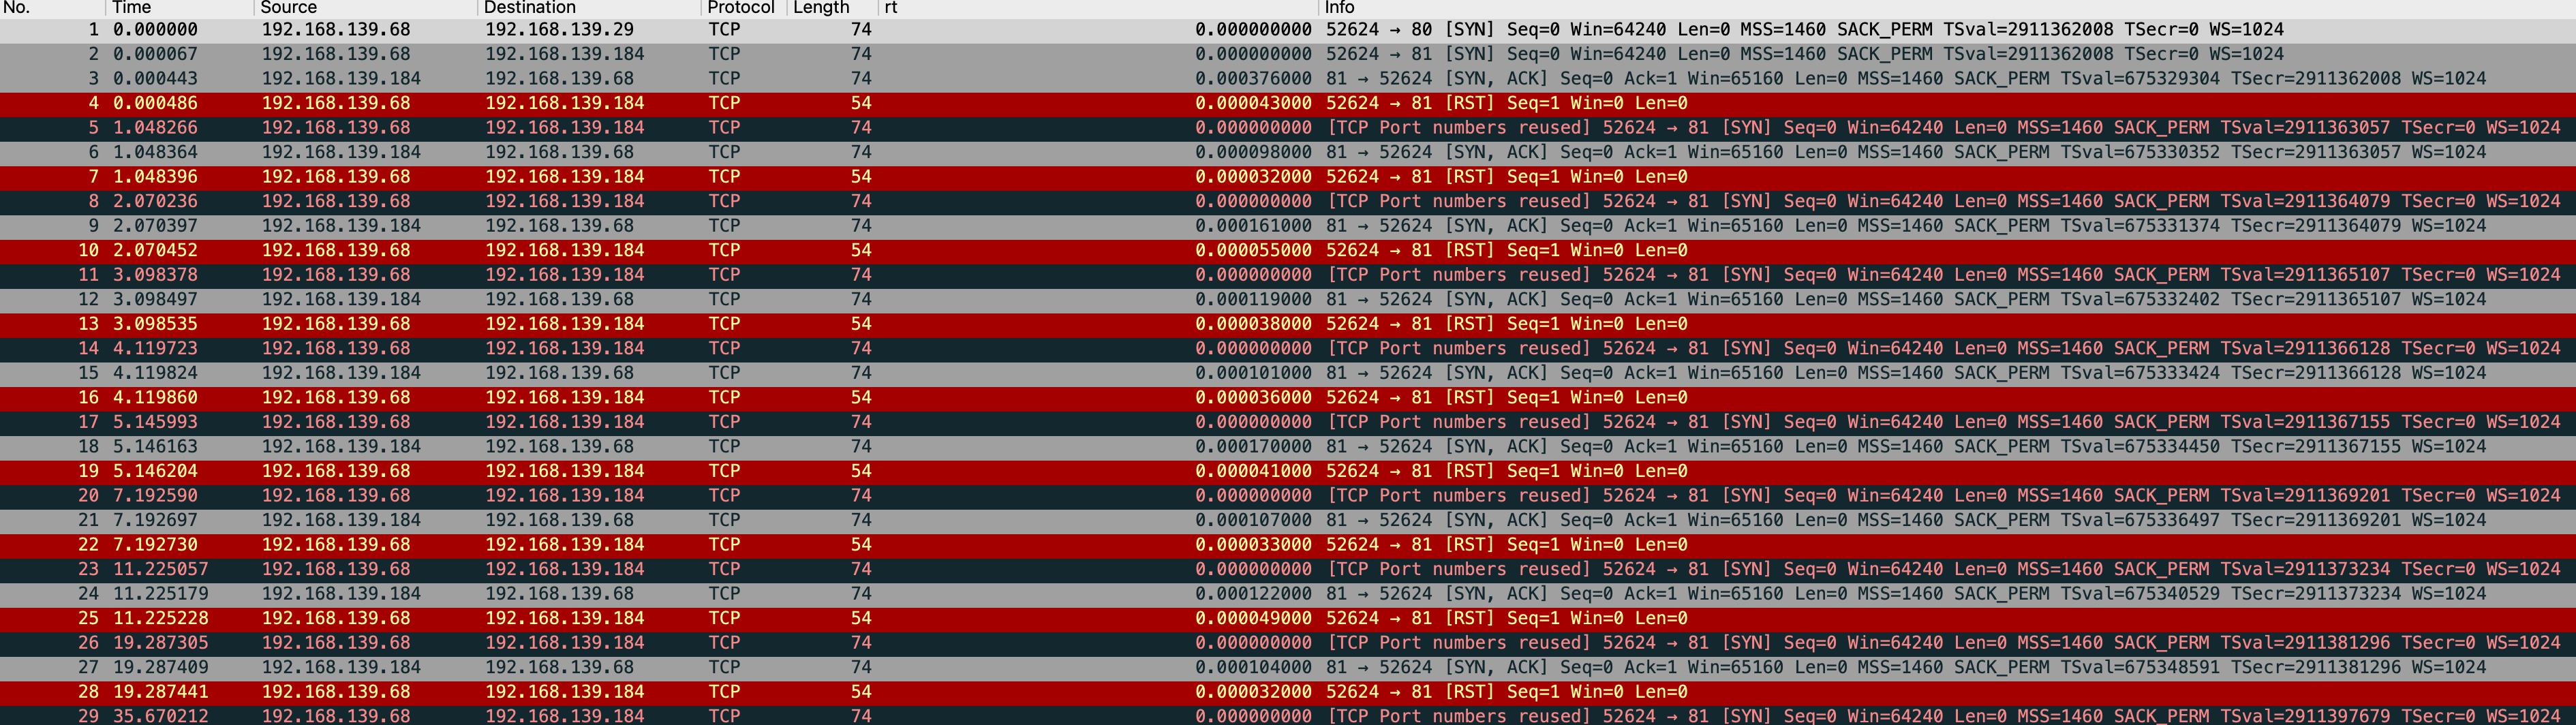
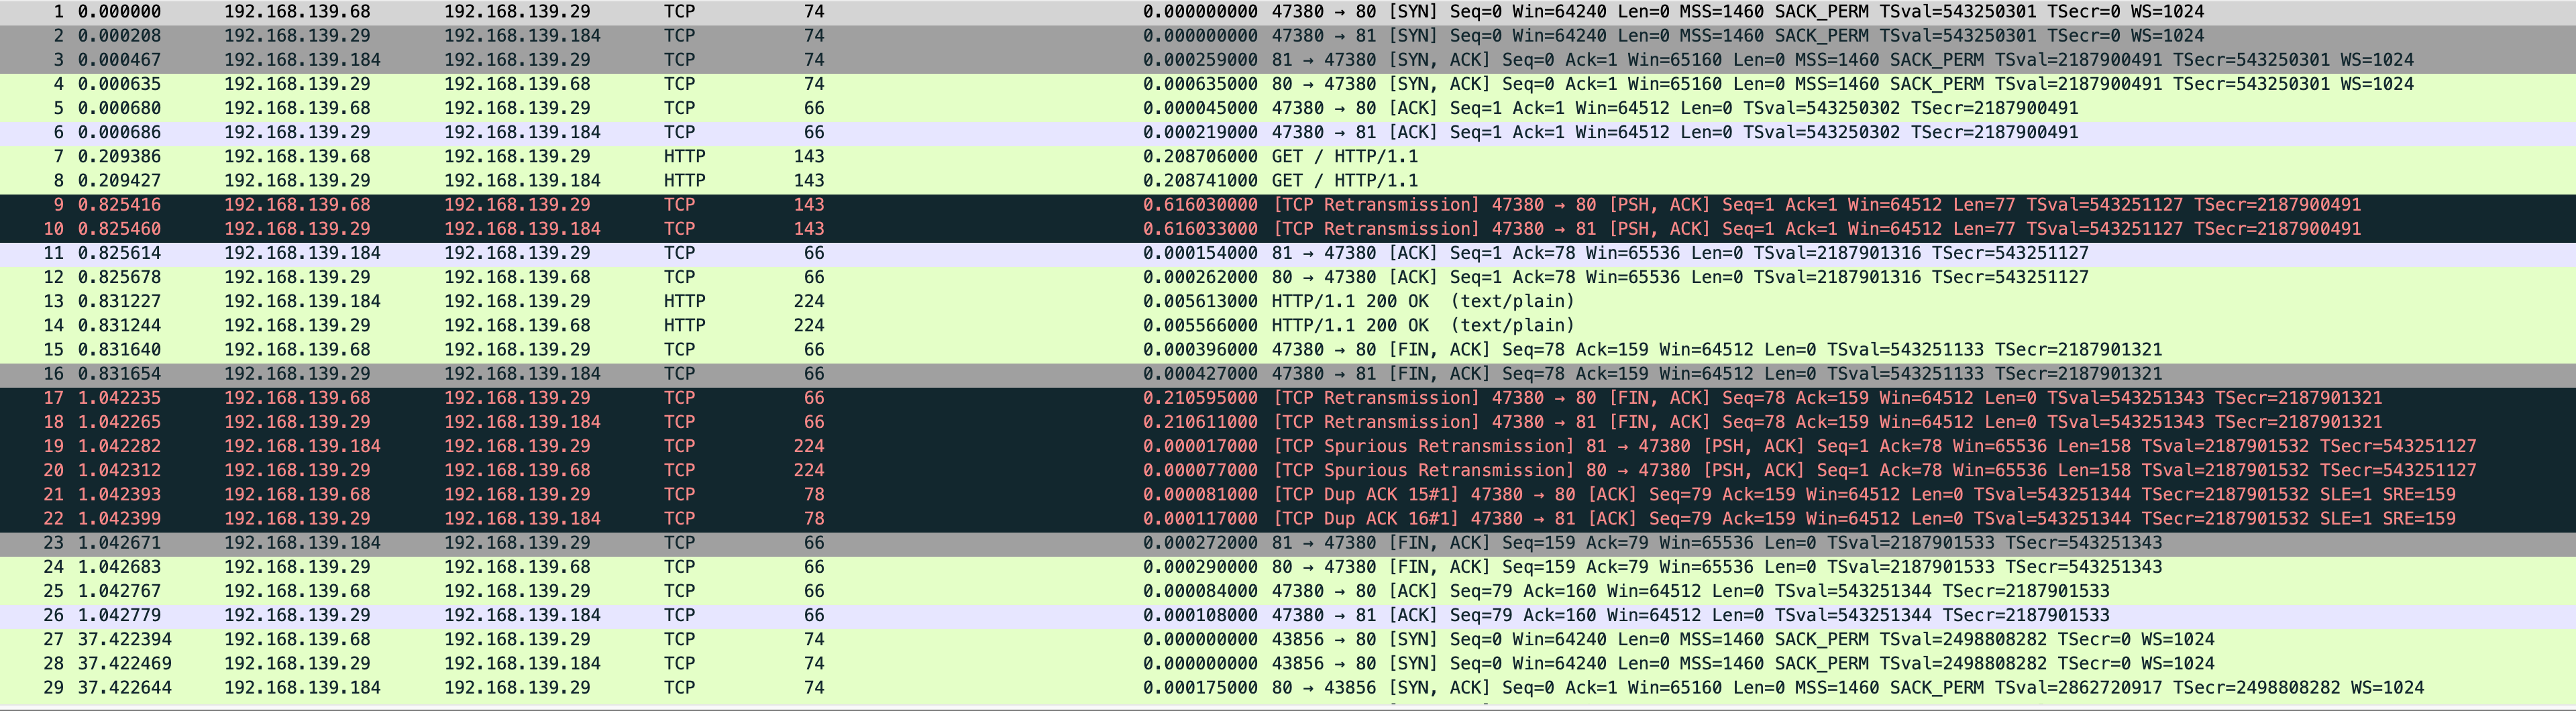
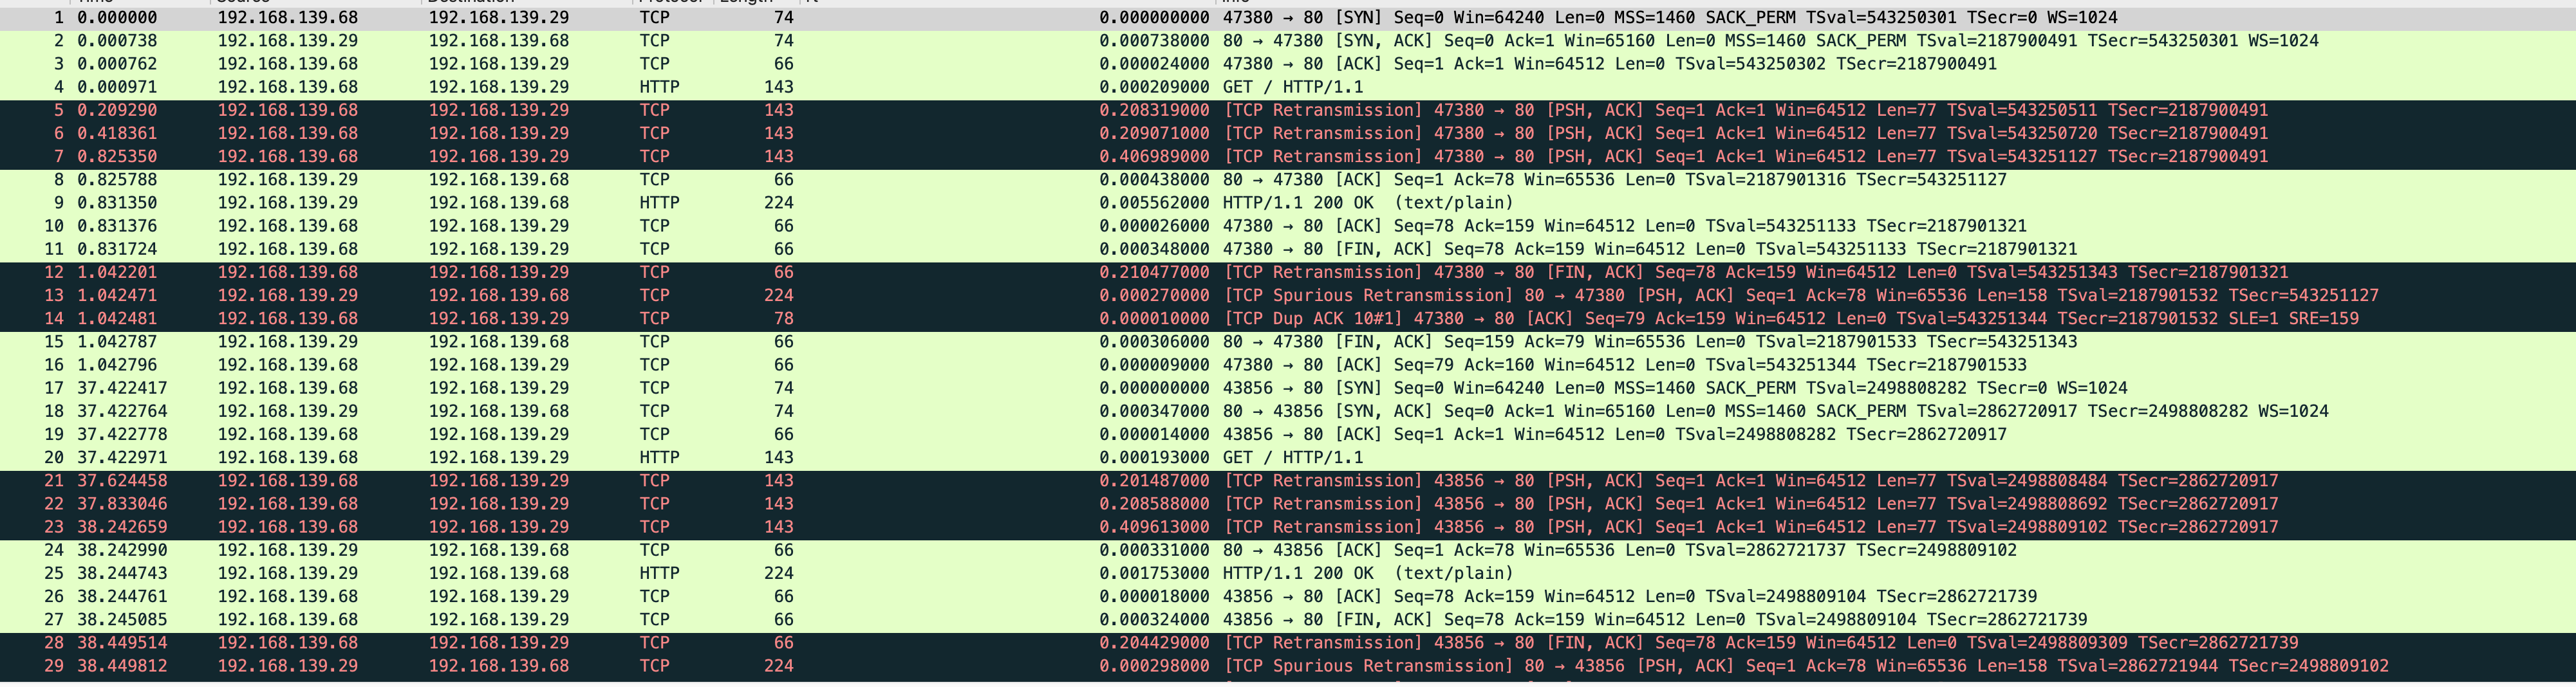
加了规则后链路通了,不过会有新的问题 在 vm-1 抓包能看到发起了重试,这很奇怪
叫 ai 分析了下
根因:net.ipv4.vs.conntrack=1 让 IPVS 跟 conntrack 共存,在连接刚建立的瞬间存在状态机竞争窗口,invalid 状态的包被丢
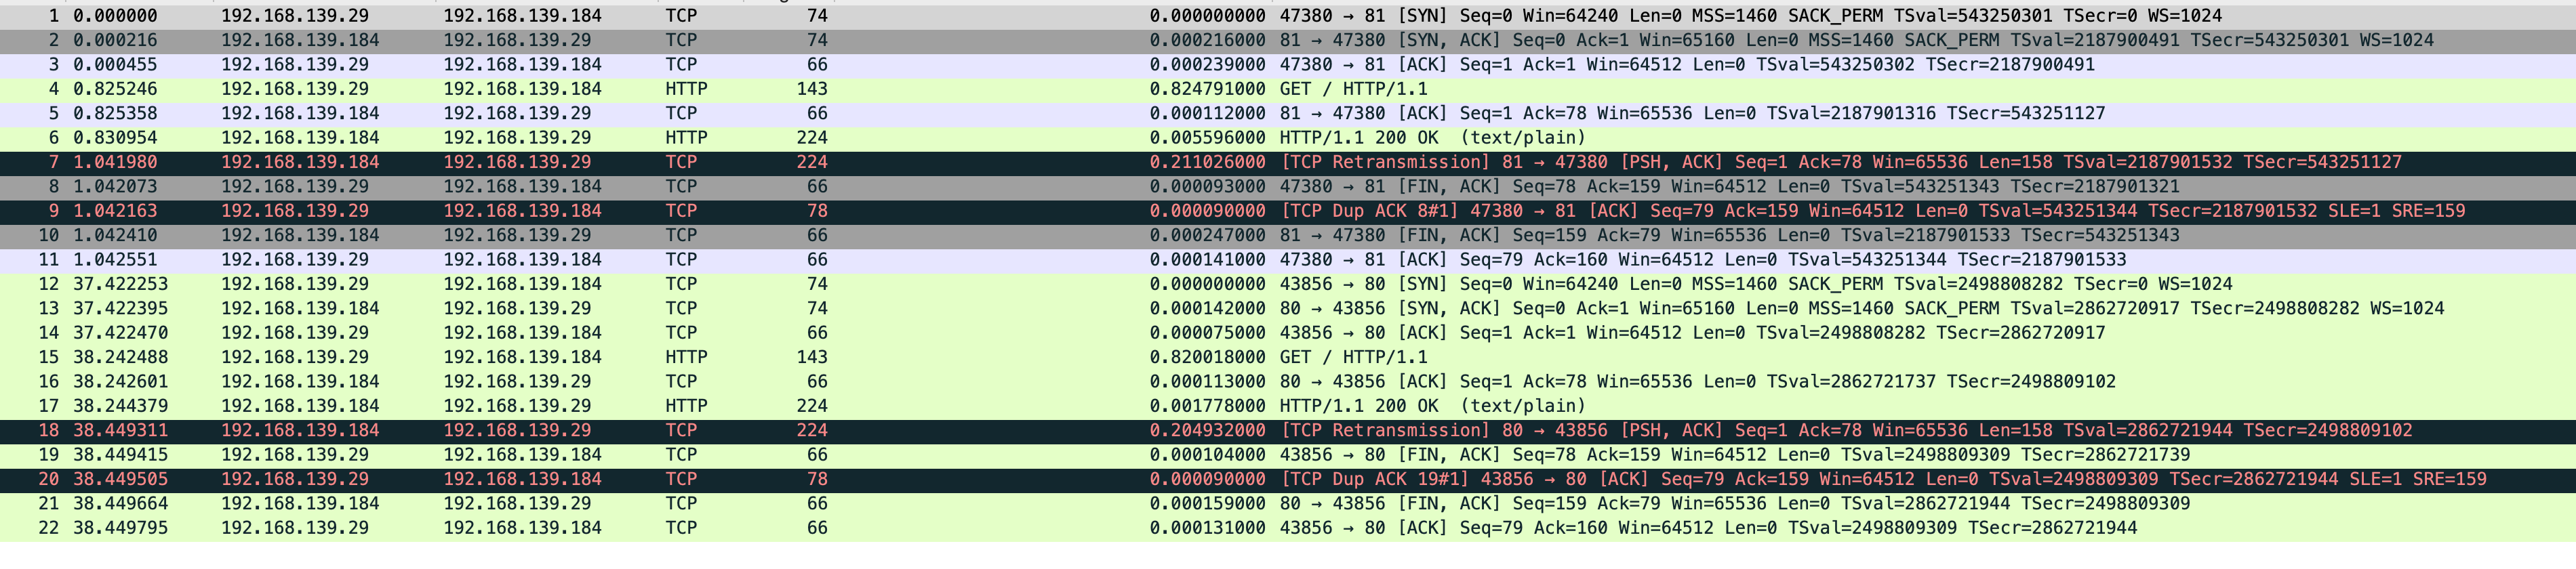
看 ipvs 视角,前 3 个 GET 的入向包都没有对应的出向(没有转发出去):

18:58:32.335745  ipvs 入向收到 GET(第 2 次重传)
               ← 没有对应的出向!
18:58:32.544XXX  ipvs 入向收到 GET(第 3 次重传)
               ← 也没有出向!
18:58:32.951XXX  ipvs 入向收到 GET(第 4 次重传)
18:58:32.951XXX  ipvs 出向转给 d2  ← 这次才转发!

ipvs 把前 3 个数据包丢了!

为什么?这是 IPVS + conntrack 的一个经典 race condition

T0: SYN              → IPVS 建立连接 → DNAT 到 d2:81 → 转发
  SYN-ACK          → ipvs → 反向 NAT → 回 vm-1
  ACK              → ipvs → 转发到 d2
T0+1ms: GET 数据包到达 ipvs
  │
  ├─ IPVS 已经知道这条 conn 转给 d2:81
  ├─ 但是 conntrack 表里这条连接还在 SYN_RECV 状态?
  │  或者 conntrack 在 GET 这一刻刚好被 d2 的 SYN-ACK 推到 ESTABLISHED,
  │  但 SNAT 状态机短暂混乱
  │
  └─ 结果:包被 conntrack 标记为 invalid 或丢弃
第 2 次重传 (200ms 后):仍然有问题,丢
第 3 次重传 (400ms 后):仍然有问题,丢
第 4 次重传 (800ms 后):状态稳定了,终于通过!

这是开了 net.ipv4.vs.conntrack=1 之后的已知副作用——IPVS 和 conntrack 两套状态机共存,握手完成的瞬间存在竞争窗口。
NAT 模式
client ─请求─► director ──NAT──► RS

client ◄───响应────── director ◄───响应─── RS

                     ↑
                     └ 必经之路!双向流量都过 director

所有包:源/目的 IP 都被改写
DR 模式
client ─请求─► director ──仅改MAC──► RS

client ◄────响应────────────────────  RS
     └─ 直接回,回程不经过 director!

请求包:IP 不变,只换二层目的 MAC
响应包:直接二层送出(看起来像 RS 自己就是 VIP)
推荐看直播录制的视频,讲的很好 很轻松 Getting into HashiCorp Consul
还有个生产部署推荐配置 production-vms
推荐使用官方源直接安装 install 配置文件和目录会直接配置好,无需自己规划
# 直接启动
$ sudo consul agent -dev -bind 192.168.139.24 -client 0.0.0.0
==> Starting Consul agent...
               Version: '1.22.5'
            Build Date: '2026-02-26 11:50:53 +0000 UTC'
               Node ID: '7da7829f-ccfd-2841-1805-540d3ee3c491'
             Node name: 'consul'
            Datacenter: 'dc1' (Segment: '<all>')
                Server: true (Bootstrap: false)
           Client Addr: [0.0.0.0] (HTTP: 8500, HTTPS: -1, gRPC: 8502, gRPC-TLS: 8503, DNS: 8600)
          Cluster Addr: 192.168.139.130 (LAN: 8301, WAN: 8302)
     Gossip Encryption: false
      Auto-Encrypt-TLS: false
           ACL Enabled: false
     Reporting Enabled: false
    ACL Default Policy: allow
             HTTPS TLS: Verify Incoming: false, Verify Outgoing: false, Min Version: TLSv1_2
              gRPC TLS: Verify Incoming: false, Min Version: TLSv1_2
      Internal RPC TLS: Verify Incoming: false, Verify Outgoing: false (Verify Hostname: false), Min Version: TLSv1_2
获取服务状态
$ curl http://127.0.0.1:8500/v1/catalog/services
{
    "consul": [],
    "nomad": [
        "serf",
        "rpc",
        "http"
    ],
    "nomad-client": [
        "http"
    ]
}
获取单个服务详细状态
$ curl http://127.0.0.1:8500/v1/catalog/service/hello-world-servers
[
    {
        "ID": "ff7990be-d401-8a26-3698-76ee6a04e0c5",
        "Node": "nomad",
        "Address": "192.168.139.24",
        "Datacenter": "dc1",
        "TaggedAddresses": {
            "lan": "192.168.139.24",
            "lan_ipv4": "192.168.139.24",
            "wan": "192.168.139.24",
            "wan_ipv4": "192.168.139.24"
        },
        "NodeMeta": {
            "consul-network-segment": "",
            "consul-version": "1.22.5"
        },
        "ServiceKind": "",
        "ServiceID": "_nomad-task-d6ec357a-55be-23b8-65ff-f95e01fd4170-group-servers-hello-world-servers-www",
        "ServiceName": "hello-world-servers",
        "ServiceTags": [],
        "ServiceAddress": "192.168.139.24",
        "ServiceTaggedAddresses": {
            "lan_ipv4": {
                "Address": "192.168.139.24",
                "Port": 23747
            },
            "wan_ipv4": {
                "Address": "192.168.139.24",
                "Port": 23747
            }
        },
        "ServiceWeights": {
            "Passing": 1,
            "Warning": 1
        },
        "ServiceMeta": {
            "external-source": "nomad"
        },
        "ServicePort": 23747,
        "ServicePorts": null,
        "ServiceSocketPath": "",
        "ServiceEnableTagOverride": false,
        "ServiceProxy": {
            "Mode": "",
            "MeshGateway": {},
            "Expose": {}
        },
        "ServiceConnect": {},
        "ServiceLocality": null,
        "CreateIndex": 32,
        "ModifyIndex": 32
    }
]
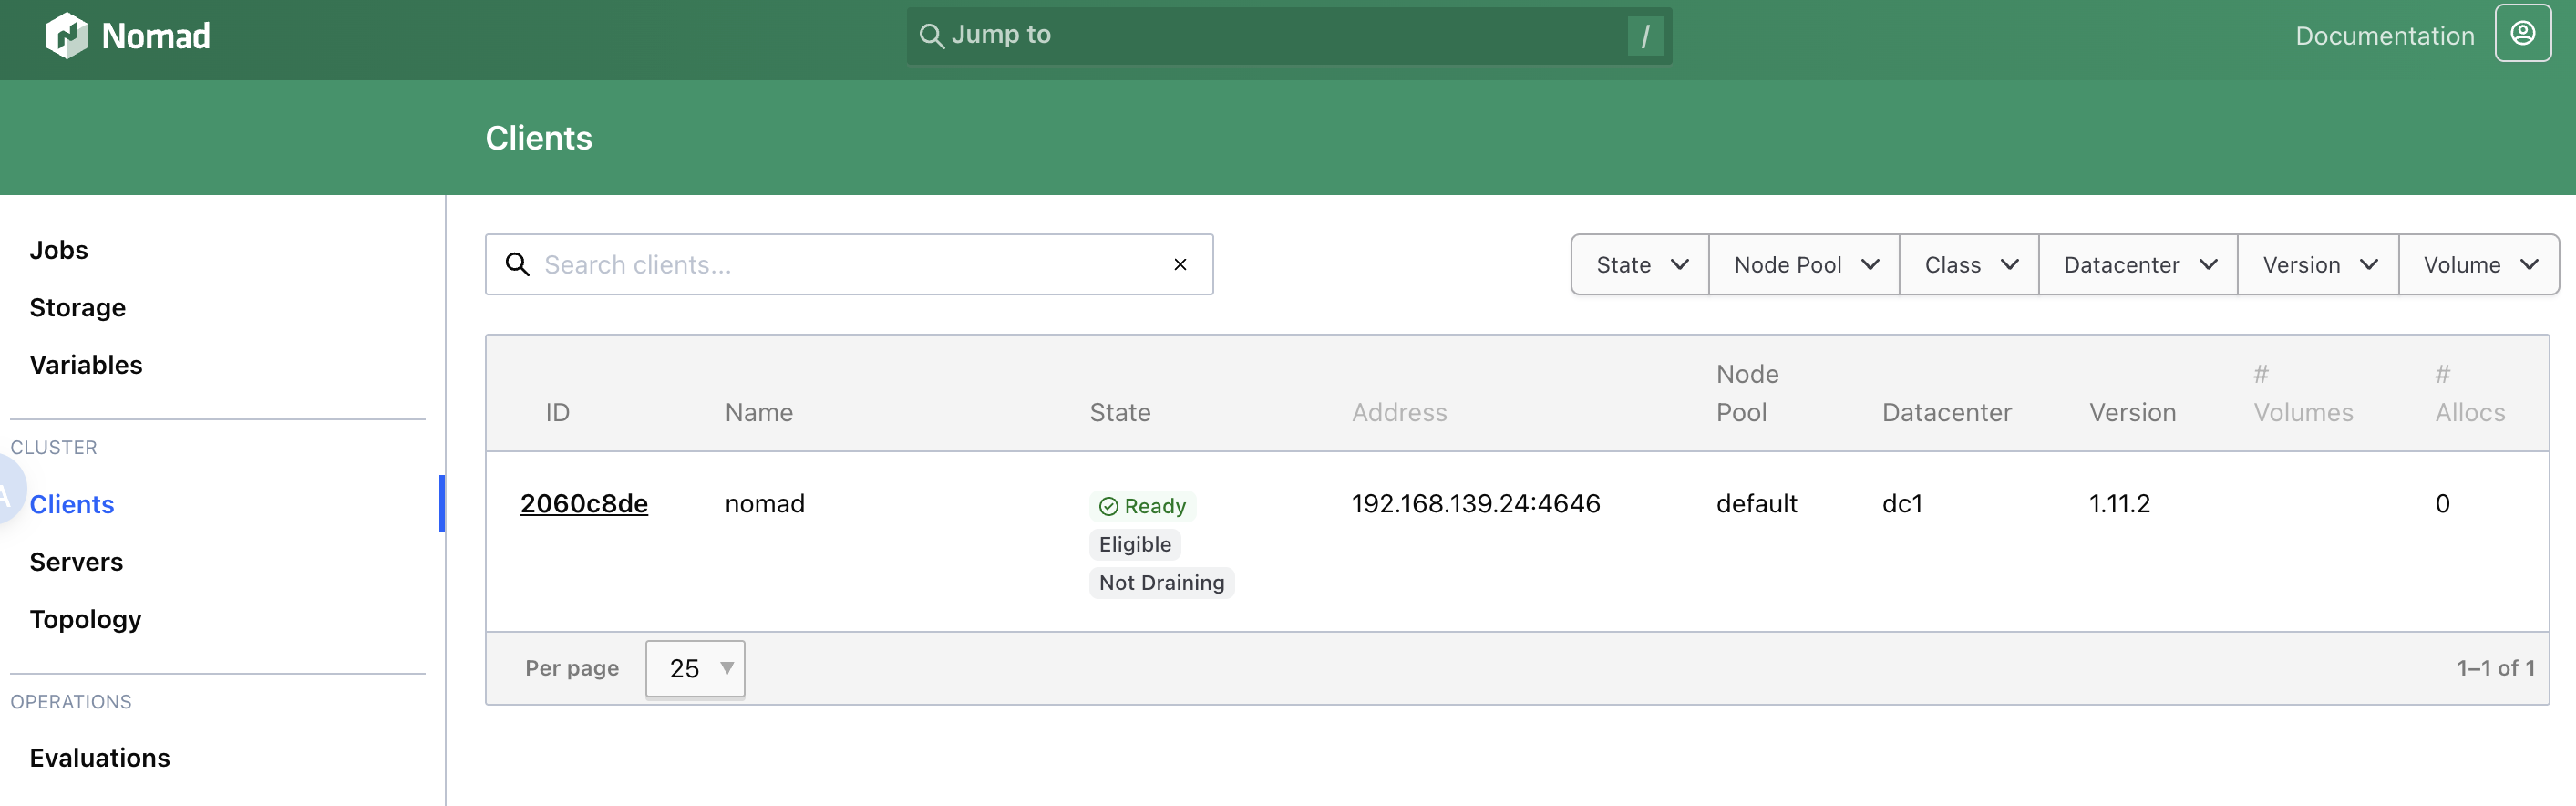
本地用的 orbstack,在 orb 创建虚拟机然后在里面部署 nomad,因为要调用 /var/run/docker.sock 不可能在装个 docker,直接把 mac 文件的 /var/run/docker.sock 做软链接拿到虚拟机里用了,虚拟机是可以直接访问 mac 文件的。
直接在机器里重新装 docker,nomad 可以直接调用
$ sudo nomad agent -dev -bind 192.168.139.24 -network-interface=eth0
$ export NOMAD_ADDR=http://localhost:4646
贴一个测试 job,会直接映射到主机端口,apisix 可直接访问到。
job "hello-world" {
  # Specifies the datacenter where this job should be run
  # This can be omitted and it will default to ["*"]
  datacenters = ["*"]

  meta {
    # User-defined key/value pairs that can be used in your jobs.
    # You can also use this meta block within Group and Task levels.
    foo = "bar"
  }

  # A group defines a series of tasks that should be co-located
  # on the same client (host). All tasks within a group will be
  # placed on the same host.
  group "servers" {

    # Specifies the number of instances of this group that should be running.
    # Use this to scale or parallelize your job.
    # This can be omitted and it will default to 1.
    count = 1

    network {
      port "www" {
        to = 8001
      }
    }

    service {
      provider = "consul"
      port     = "www"
      address_mode = "host"
    }

    # Tasks are individual units of work that are run by Nomad.
    task "web" {
      # This particular task starts a simple web server within a Docker container
      driver = "docker"

      config {
        image   = "busybox:1"
        command = "httpd"
        args    = ["-v", "-f", "-p", "${NOMAD_PORT_www}", "-h", "/local"]
        ports   = ["www"]
      }

      template {
        data        = <<-EOF
                      <h1>Hello, Nomad!</h1>
                      <ul>
                        <li>Task: {{env "NOMAD_TASK_NAME"}}</li>
                        <li>Group: {{env "NOMAD_GROUP_NAME"}}</li>
                        <li>Job: {{env "NOMAD_JOB_NAME"}}</li>
                        <li>Metadata value for foo: {{env "NOMAD_META_foo"}}</li>
                        <li>Currently running on port: {{env "NOMAD_PORT_www"}}</li>
                      </ul>
                      EOF
        destination = "local/index.html"
      }

      # Specify the maximum resources required to run the task
      resources {
        cpu    = 50
        memory = 64
      }
    }
  }
}
填加一个路由转发到 consul 中的 hello-world
$ curl http://127.0.0.1:9180/apisix/admin/routes/1 -H "X-API-KEY: edd1c9f034335f136f87ad84b625c8f1" -X PUT -i -d '
{
    "uri": "/*",
    "upstream": {
        "service_name": "hello-world-servers",
        "type": "roundrobin",
        "discovery_type": "consul"
    }
}'
获取状态
$ curl -s http://127.0.0.1:9180/apisix/admin/routes\?api_key\=edd1c9f034335f136f87ad84b625c8f1|jq
作者姓名:吕文翰
原始网站地址:https://pphc.lvwenhan.com
文中看到一张静态图片 “Nginx 的性能是 Apache 的四倍”
nginx 和 apache 均未更改配置,直接使用容器启动 根目录替换为一张图片。
$ docker run --rm -dit --name pphc-nginx -v /Downloads/jovan-vasiljevic-l6qGo5zKswU-unsplash.jpg:/usr/share/nginx/html/jovan.jpg:ro -d nginx:stable
$ oha -n 10000 -c 4 --connect-to 'pphc-nginx.orb.local:80:192.168.215.2:80' --latency-correction --disable-keepalive http://pphc-nginx.orb.local/jovan.jpg
Summary:
  Success rate:	100.00%
  Total:	5859.5672 ms
  Slowest:	21.9470 ms
  Fastest:	1.2468 ms
  Average:	2.3418 ms
  Requests/sec:	1706.6107

  Total data:	23.88 GiB
  Size/request:	2.45 MiB
  Size/sec:	4.08 GiB

Response time histogram:
   1.247 ms [1]    |
   3.317 ms [9547] |■■■■■■■■■■■■■■■■■■■■■■■■■■■■■■■■
   5.387 ms [433]  |■
   7.457 ms [9]    |
   9.527 ms [2]    |
  11.597 ms [2]    |
  13.667 ms [2]    |
  15.737 ms [1]    |
  17.807 ms [0]    |
  19.877 ms [1]    |
  21.947 ms [2]    |

Response time distribution:
  10.00% in 1.8269 ms
  25.00% in 1.9920 ms
  50.00% in 2.2289 ms
  75.00% in 2.5561 ms
  90.00% in 2.9806 ms
  95.00% in 3.2815 ms
  99.00% in 3.9765 ms
  99.90% in 7.9387 ms
  99.99% in 21.8587 ms


Details (average, fastest, slowest):
  DNS+dialup:	0.1799 ms, 0.0535 ms, 3.3844 ms
  DNS-lookup:	0.0029 ms, 0.0010 ms, 0.4548 ms

Status code distribution:
  [200] 10000 responses
$ docker run --rm -dit --name pphc-apache -v /Downloads/jovan-vasiljevic-l6qGo5zKswU-unsplash.jpg:/usr/local/apache2/htdocs/jovan.jpg:ro httpd
oha -n 10000 -c 4 --connect-to 'pphc-apache.orb.local:80:192.168.215.3:80' --latency-correction --disable-keepalive http://pphc-apache.orb.local/jovan.jpg
Summary:
  Success rate:	100.00%
  Total:	6991.0027 ms
  Slowest:	22.5767 ms
  Fastest:	1.4700 ms
  Average:	2.7935 ms
  Requests/sec:	1430.4100

  Total data:	23.88 GiB
  Size/request:	2.45 MiB
  Size/sec:	3.42 GiB

Response time histogram:
   1.470 ms [1]    |
   3.581 ms [9035] |■■■■■■■■■■■■■■■■■■■■■■■■■■■■■■■■
   5.691 ms [904]  |■■■
   7.802 ms [43]   |
   9.913 ms [7]    |
  12.023 ms [3]    |
  14.134 ms [3]    |
  16.245 ms [0]    |
  18.355 ms [0]    |
  20.466 ms [0]    |
  22.577 ms [4]    |

Response time distribution:
  10.00% in 2.1455 ms
  25.00% in 2.3568 ms
  50.00% in 2.6547 ms
  75.00% in 3.0646 ms
  90.00% in 3.5604 ms
  95.00% in 3.9060 ms
  99.00% in 4.9914 ms
  99.90% in 9.9304 ms
  99.99% in 22.5364 ms


Details (average, fastest, slowest):
  DNS+dialup:	0.2219 ms, 0.0607 ms, 2.7639 ms
  DNS-lookup:	0.0044 ms, 0.0010 ms, 0.4934 ms

Status code distribution:
  [200] 10000 responses
能看到实际 nginx 和 apache 差别没那么大,或许是在特定年代的特殊情况,不过两次请求都有一个问题 “总会有几个请求处理时间过长,尽管大部分请求会很快完成”
文中说到 api 网关能玩出花来,本地弄了个 apisix,顺便结合 nomad 和 consul 测试下。
先测试下 apisix,根据官方文档配置了个 route,通过 api 看看结果
$ curl -s http://127.0.0.1:9180/apisix/admin/routes\?api_key\=edd1c9f034335f136f87ad84b625c8f1 | jq
{
  "total": 1,
  "list": [
    {
      "key": "/apisix/routes/00000000000000000015",
      "value": {
        "status": 1,
        "id": "00000000000000000015",
        "enable_websocket": false,
        "update_time": 1772193933,
        "priority": 0,
        "name": "getting-started-ip",
        "upstream": {
          "pass_host": "pass",
          "tls": {
            "verify": false
          },
          "nodes": [
            {
              "priority": 0,
              "host": "httpbin.org",
              "port": 80,
              "weight": 0
            }
          ],
          "type": "roundrobin",
          "hash_on": "vars",
          "checks": {
            "active": {
              "host": "httpbin.org",
              "type": "http",
              "healthy": {
                "http_statuses": [
                  200
                ],
                "interval": 1,
                "successes": 200
              },
              "https_verify_certificate": false,
              "port": 80,
              "timeout": 2
            }
          },
          "scheme": "http"
        },
        "methods": [
          "GET"
        ],
        "uri": "/ip",
        "create_time": 1772193933
      },
      "modifiedIndex": 16,
      "createdIndex": 16
    }
  ]
}
直接将请求转发到 httpbin.org 了
$ curl http://127.0.0.1:9080/ip
{
  "origin": "192.168.117.1, 185.220.238.225"
}
nomad 也是很有趣的服务管理部署应用,和 terraform 是同公司,它只是做服务管理 像服务发现这类就交给 consul 测试的话配置起来不复杂,我的想法是这样:用 consul 将 nomad 和 apisix 连通,consul 也能给 nomad 管理的容器做健康检查 服务发现,apisix 找上游服务器通过 consul。
最简单的架构,此状态下最基础是 consul
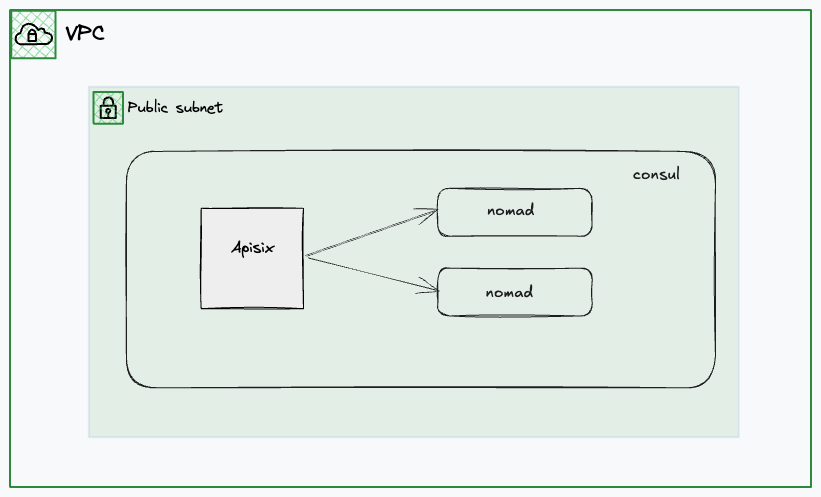
配置过程可查看 consul + nomad + apisix
最后结果如下
$ curl -s 127.0.0.1:9080
<h1>Hello, Nomad!</h1>
<ul>
  <li>Task: web</li>
  <li>Group: servers</li>
  <li>Job: hello-world</li>
  <li>Metadata value for foo: bar</li>
  <li>Currently running on port: 8001</li>
</ul>
如果要作为生产环境需要考虑的有很多,上面仅是测试
直接用 alma 省事
$ npm install -g @musistudio/claude-code-router
$ curl -fsSL https://claude.ai/install.sh | bash

                    or

$ npm install -g @anthropic-ai/claude-code