一个数据包的生命周期
实验流程来自:01|一个数据包的网络之旅:网络是如何工作的?
也可以阅读此文章:life-of-a-packet-in-the-linux-kernel
通过一个 HTTP 请求来观察数据包的旅程
$ sudo tcpdump -s0 -X -nn "tcp port 80" -w packet.pcap --print
$ curl -o /dev/null -v http://example.com
  % Total    % Received % Xferd  Average Speed   Time    Time     Time  Current
                                 Dload  Upload   Total   Spent    Left  Speed
  0     0    0     0    0     0      0      0 --:--:-- --:--:-- --:--:--     0* Host example.com:80 was resolved.
* IPv6: 2600:1406:5e00:6::17ce:bc1b, 2600:1408:ec00:36::1736:7f24, 2600:1406:bc00:53::b81e:94ce, 2600:1408:ec00:36::1736:7f31, 2600:1406:5e00:6::17ce:bc12, 2600:1406:bc00:53::b81e:94c8
* IPv4: 23.215.0.136, 23.192.228.80, 23.220.75.232, 23.220.75.245, 23.192.228.84, 23.215.0.138
*   Trying 23.215.0.136:80...
* Connected to example.com (23.215.0.136) port 80
> GET / HTTP/1.1
> Host: example.com
> User-Agent: curl/8.5.0
> Accept: */*
>
  0     0    0     0    0     0      0      0 --:--:--  0:00:01 --:--:--     0< HTTP/1.1 200 OK
< Content-Type: text/html
< ETag: "bc2473a18e003bdb249eba5ce893033f:1760028122.592274"
< Last-Modified: Thu, 09 Oct 2025 16:42:02 GMT
< Cache-Control: max-age=86000
< Date: Fri, 28 Nov 2025 08:31:14 GMT
< Content-Length: 513
< Connection: keep-alive
<
{ [513 bytes data]
100   513  100   513    0     0    418      0  0:00:01  0:00:01 --:--:--   418
* Connection #0 to host example.com left intact
先是 dns 解析,知道 ip 后和 23.215.0.136:80 tcp 连接
* IPv6: 2600:1406:5e00:6::17ce:bc1b, 2600:1408:ec00:36::1736:7f24, 2600:1406:bc00:53::b81e:94ce, 2600:1408:ec00:36::1736:7f31, 2600:1406:5e00:6::17ce:bc12, 2600:1406:bc00:53::b81e:94c8
* IPv4: 23.215.0.136, 23.192.228.80, 23.220.75.232, 23.220.75.245, 23.192.228.84, 23.215.0.138
*   Trying 23.215.0.136:80...
连接成功后发送 GET / 请求
> GET / HTTP/1.1
> Host: example.com
> User-Agent: curl/8.5.0
> Accept: */*
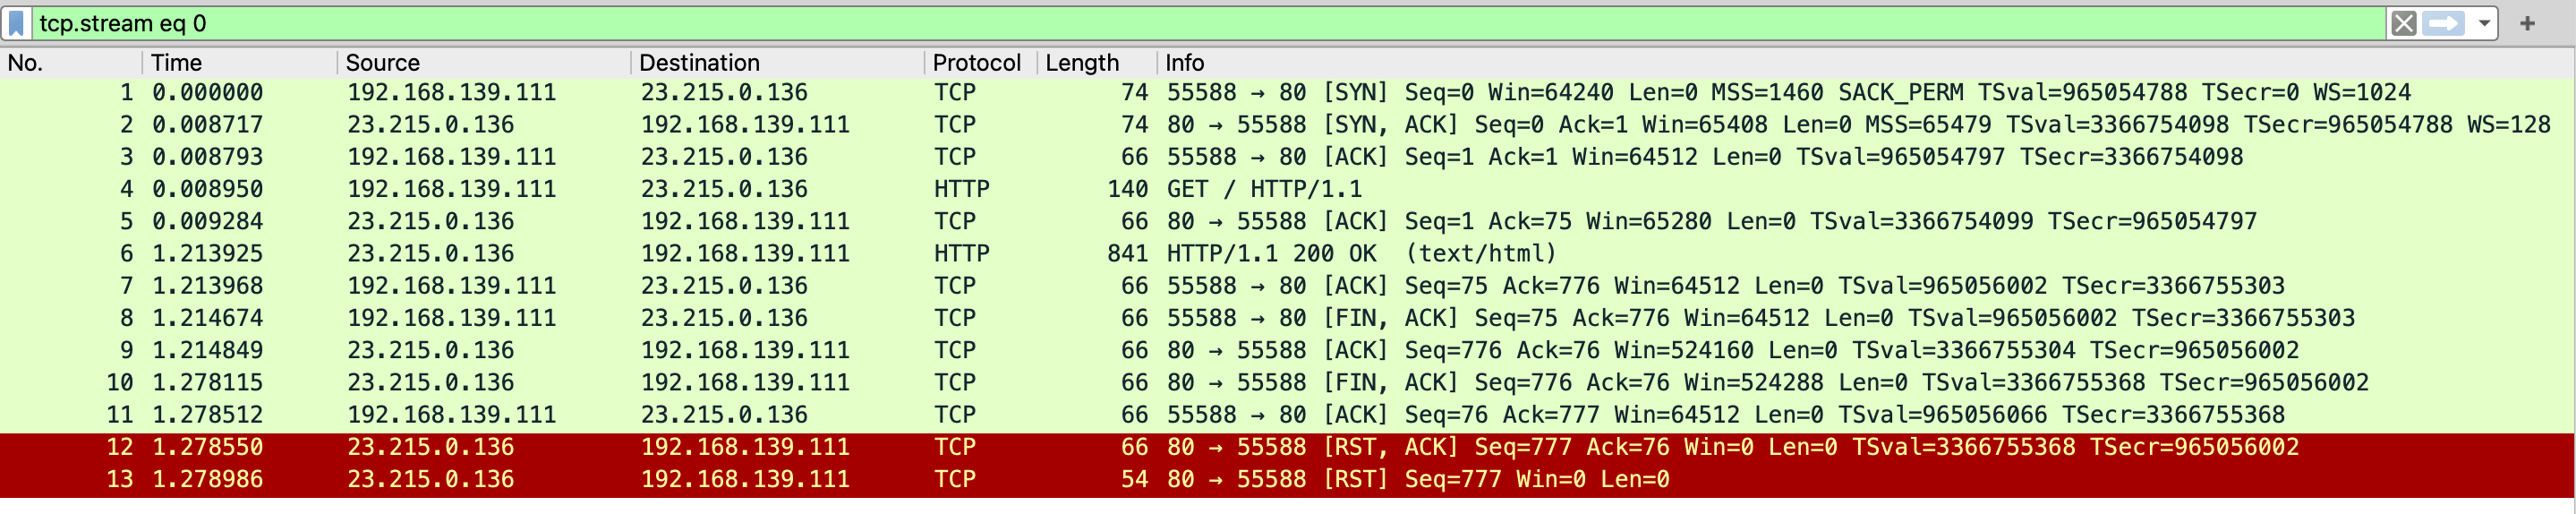
example.com 回复 http 状态码 200,在通过抓包看本地机器 192.168.139.111 发起了 tcp 连接关闭
< HTTP/1.1 200 OK
< Content-Type: text/html
< ETag: "bc2473a18e003bdb249eba5ce893033f:1760028122.592274"
< Last-Modified: Thu, 09 Oct 2025 16:42:02 GMT
< Cache-Control: max-age=86000
< Date: Fri, 28 Nov 2025 08:31:14 GMT
< Content-Length: 513
< Connection: keep-alive
网络分层
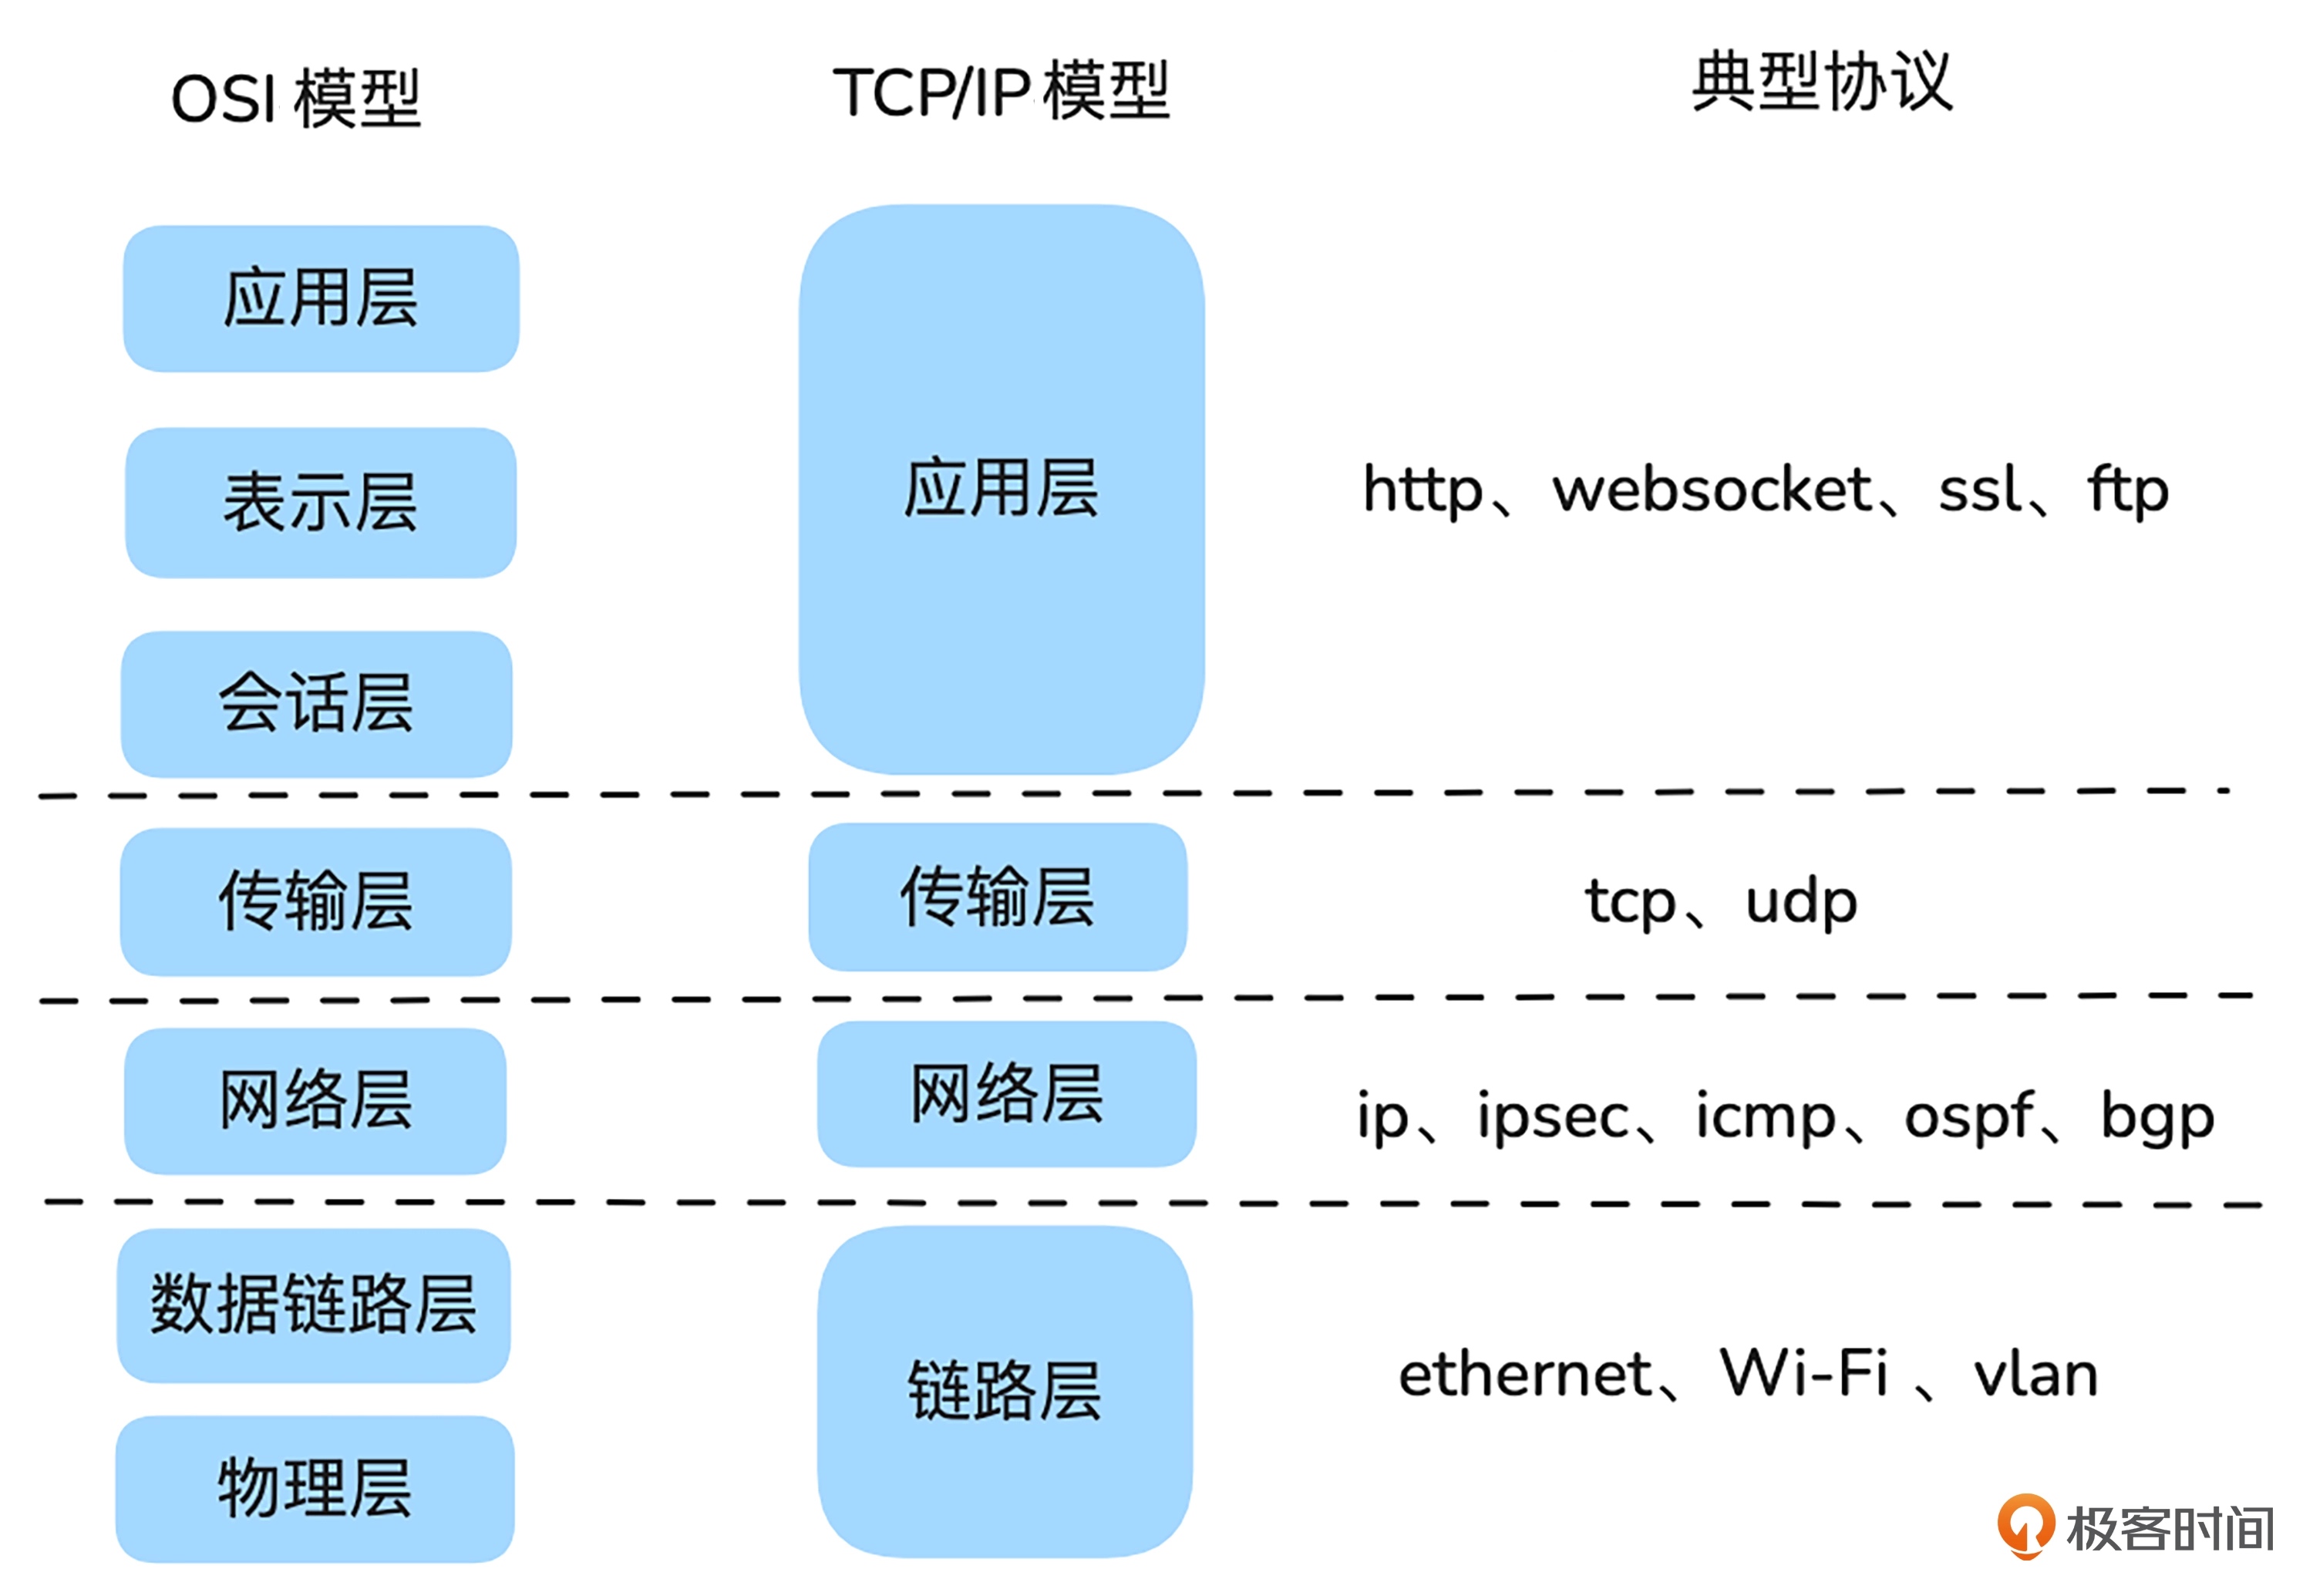
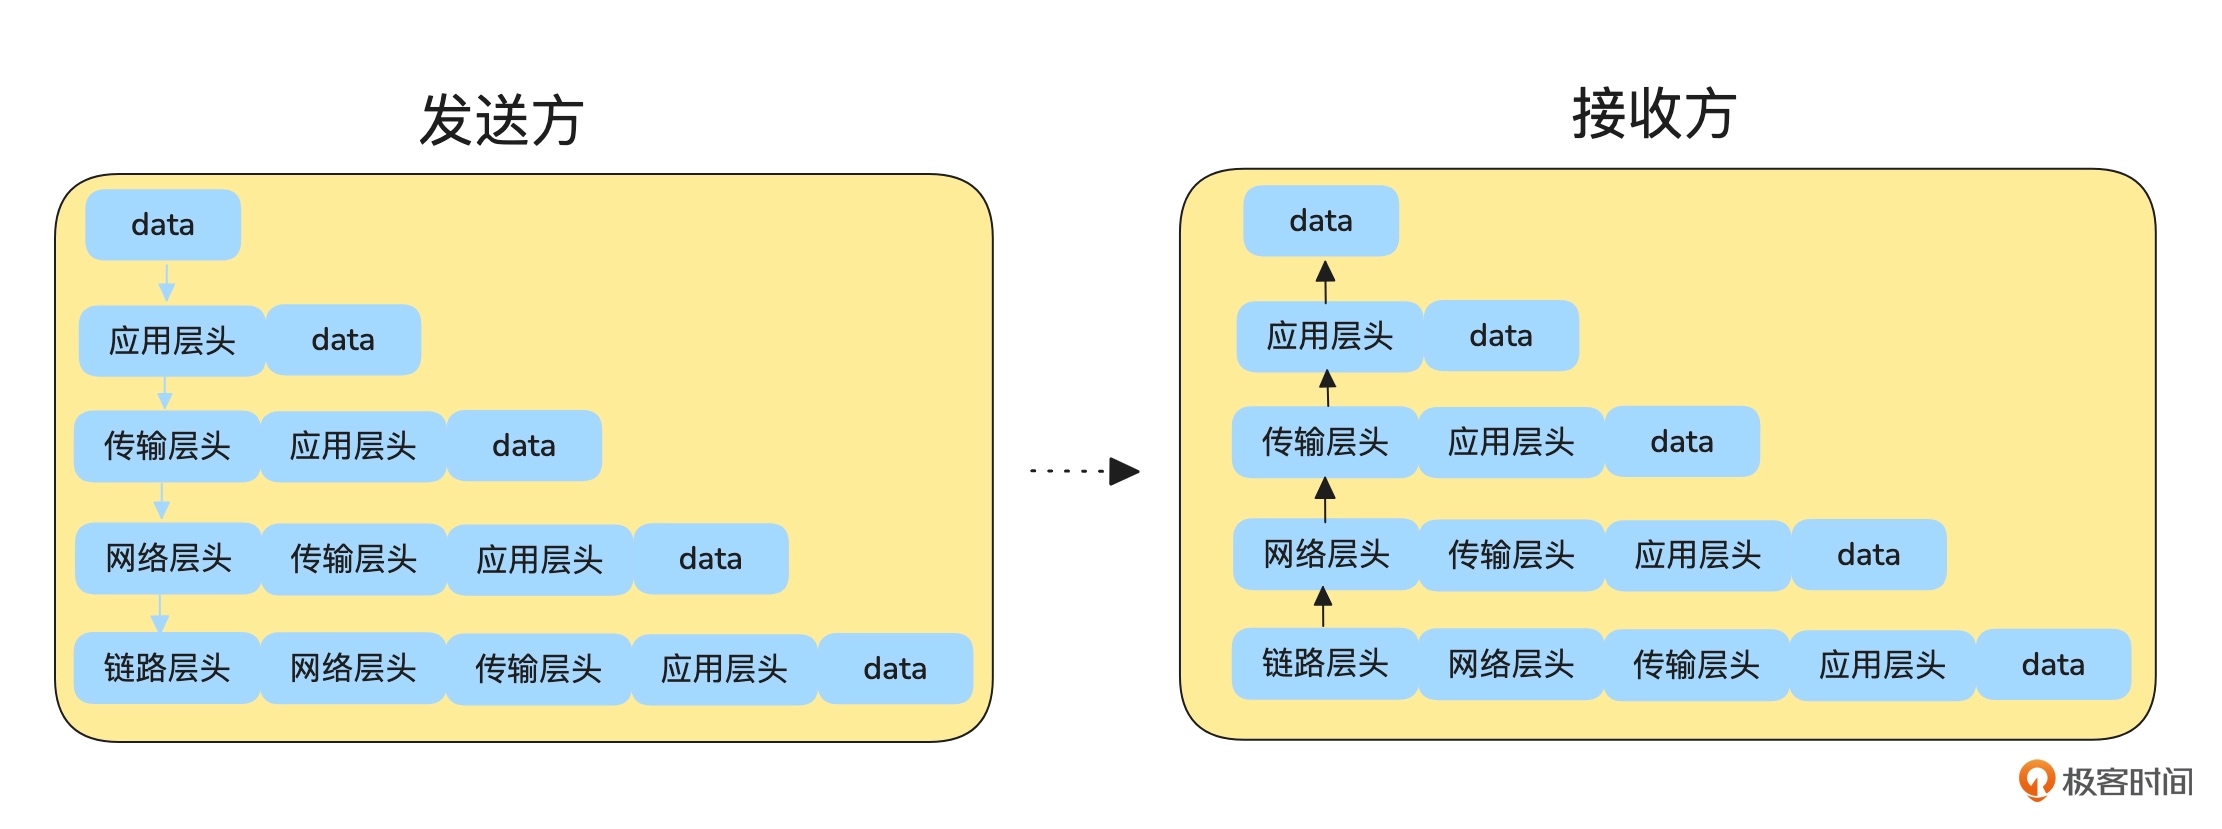
图片来自:网络架构实战课
穿过客户端局域网
一句话总结:同局域网 arp 查询 mac 直接发送,不同局域网路由发送
计算下我的 ip 和 example.com 的 ip 在不在同一局域网
$ ifconfig
eth0: flags=4163<UP,BROADCAST,RUNNING,MULTICAST>  mtu 1500
        inet 192.168.139.111  netmask 255.255.255.0  broadcast 192.168.139.255
        inet6 fd07:b51a:cc66:0:a0db:deff:fea3:9cb5  prefixlen 64  scopeid 0x0<global>
        inet6 fe80::a0db:deff:fea3:9cb5  prefixlen 64  scopeid 0x20<link>
        ether a2:db:de:a3:9c:b5  txqueuelen 1000  (Ethernet)
        RX packets 46016  bytes 17701736 (17.7 MB)
        RX errors 0  dropped 0  overruns 0  frame 0
        TX packets 330  bytes 29500 (29.5 KB)
        TX errors 0  dropped 0 overruns 0  carrier 0  collisions 0

# 128 64 32 16 8 4 2 1
# 这里的对比是拿本机的子网掩码去和目的ip和本机ip对比,网络位相同则在同一网络

本机:192.168.139.111 子网掩码:255.255.255.0

IP:         11000000.10101000.10001011.01101111
子网掩码:     11111111.11111111.11111111.00000000
按位与运算:    11000000.10101000.10001011.00000000
网络位:        192.168.139.0

example.com:23.215.0.136

IP:          00010111.11010111.00000000.10001000
子网掩码:      11111111.11111111.11111111.00000000
按位与运算:     00010111.11010111.00000000.00000000
网络位:         23.215.0.0
既然不在一定会走路由规则,能看到走 192.168.139.1 网关设备是 eth0
$ ip route get 23.215.0.136
23.215.0.136 via 192.168.139.1 dev eth0 src 192.168.139.111 uid 501
    cache
网关一定是和主机在同一网络,观察下 arp 是怎么工作的
$ sudo arp -d 192.168.139.1

$ sudo tcpdump -s0 -X -nn "arp" -w arp.pcap --print
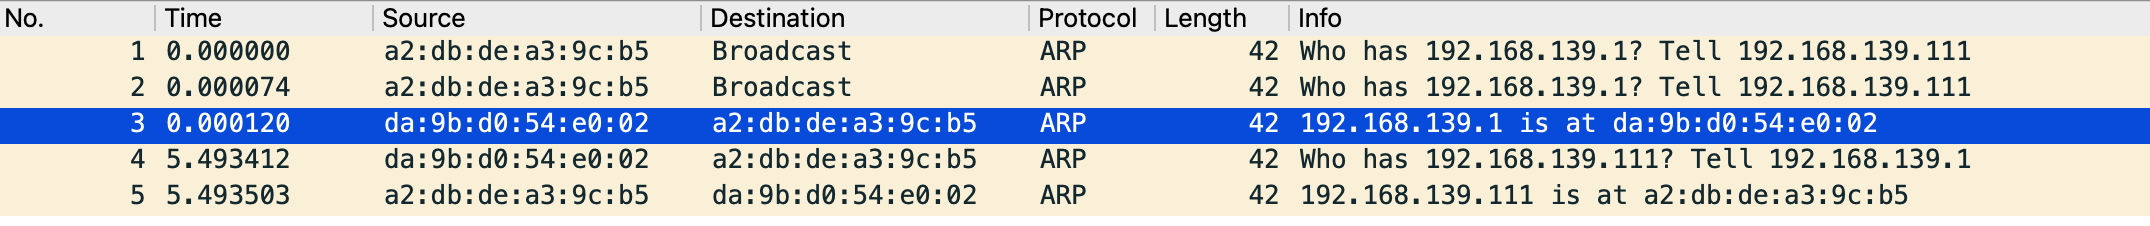
$ arp -n
Address                  HWtype  HWaddress           Flags Mask            Iface
192.168.139.1            ether   da:9b:d0:54:e0:02   C                     eth0
traceroute 查看也是一样,虽然解析的 ip 不同但不影响
$ sudo traceroute -n -I example.com
traceroute to example.com (23.220.75.232), 30 hops max, 60 byte packets
 1  192.168.139.1  0.036 ms  0.014 ms  0.005 ms
 2  192.168.1.1  4.661 ms  4.647 ms  4.642 ms
 3  * 100.101.0.1  12.028 ms *
 4  * * *
 5  * * *
 6  * * *
 7  * * *
 8  * * *
 9  * * *
10  * * *
11  * * *
12  * * *
13  * * *
14  23.220.75.232  186.684 ms  186.577 ms  260.319 ms
推荐使用 NextTrace
在服务器上测试中间设备会响应 icmp 协议,可能是个人住址经过的设备屏蔽了 icmp
$ traceroute -I -n -m 50 example.com
traceroute to example.com (23.220.75.245), 50 hops max, 60 byte packets
 1  10.59.252.86  1.378 ms  1.446 ms  1.442 ms
 2  11.73.60.253  1.937 ms * *
 3  26.25.187.33  1.519 ms  1.529 ms  1.630 ms
 4  10.216.220.118  3.104 ms  3.179 ms  3.160 ms
 5  10.216.229.106  3.177 ms  3.178 ms  3.232 ms
 6  * * *
 7  * * *
 8  * * *
 9  * * *
10  * * *
11  * * *
12  219.158.5.174  178.130 ms  178.125 ms  178.145 ms
13  * * *
14  154.54.77.53  162.103 ms  162.088 ms  162.185 ms
15  154.54.63.70  157.864 ms  157.916 ms  157.911 ms
16  154.54.47.165  238.095 ms  238.125 ms  243.526 ms
17  154.54.169.178  260.650 ms  260.635 ms  260.638 ms
18  154.54.29.134  249.462 ms  249.394 ms  248.589 ms
19  154.54.40.249  249.505 ms  249.495 ms *
20  154.54.165.26  247.671 ms  249.877 ms  250.234 ms
21  154.54.166.58  251.909 ms  252.616 ms  252.628 ms
22  154.54.44.86  254.282 ms  254.289 ms  254.572 ms
23  154.54.27.118  250.352 ms  252.829 ms  252.919 ms
24  38.104.84.101  236.554 ms  236.499 ms  236.548 ms
25  218.30.54.6  242.952 ms  242.911 ms  242.916 ms
26  * * *
27  * * *
28  * * *
29  23.220.75.245  239.147 ms  236.590 ms  239.235 ms
推荐案例
分析了下此篇文章的问题,很有趣 0.01% 的概率超时问题
我的回答是:
两个包还有个区别

正常的:server 会给 client 发 zerowindow 随后又发 window update,server 处理的慢但节奏在 server 这里。

超时的:没看到窗口更新的包 都是 client 给 server 发送,2136 包到 2149包能看到重试 15次。

要说 server 处理的慢,只看到一次超时后面全部正常,你说中间设备处理的有问题吧 它还只有0.01的超时概率
作者给了回复:
zero window 在这里其实是一个好的现象。

数据进入的处理路径是:

NIC -> Kernel process -> tcp connection buffer -> 应用程序读取

正常的:

正是因为 kernel 处理的速度够快,才能填满 buffer,应用程序处理的不够快,导致 buffer 填满了,接收端发送 zero window 让发送端暂停发送。

超时的:

因为 kernel 处理的带宽(由于没有开启 LRO)变慢,导致无法填满 buffer,所以不会出现 zero window。同时,由于 NIC 收包比较快,很可呢是 kernel 处理不过来,导致了丢包。
当时看到这个分析又重新对比了两个包,确实是像关了网卡 Offload 功能,关于 Offload 之前测试时碰到过在这里 TCP 数据的发送和接收,同时又能看到数据包里都是 vxlan 封装了一层发送的数据,分析下来就会认为是 server 的处理能力不够导致,后面作者回复后又想了想,为什么 server 处理能力不够呢 其实并不是,因为之前没替换设备是正常的,所以是因为 NIC 收包快 kernal 处理变慢,才会以为是 server 处理能力不够。
借助 zero window 看到的现象,直接进行分析得出的结论还是太草率,不是根本原因。